Mastering Technical Analysis and Indicators for Bitcoin Trading
Learn how to effectively use technical analysis and indicators to enhance your Bitcoin trading strategies and make informed decisions.
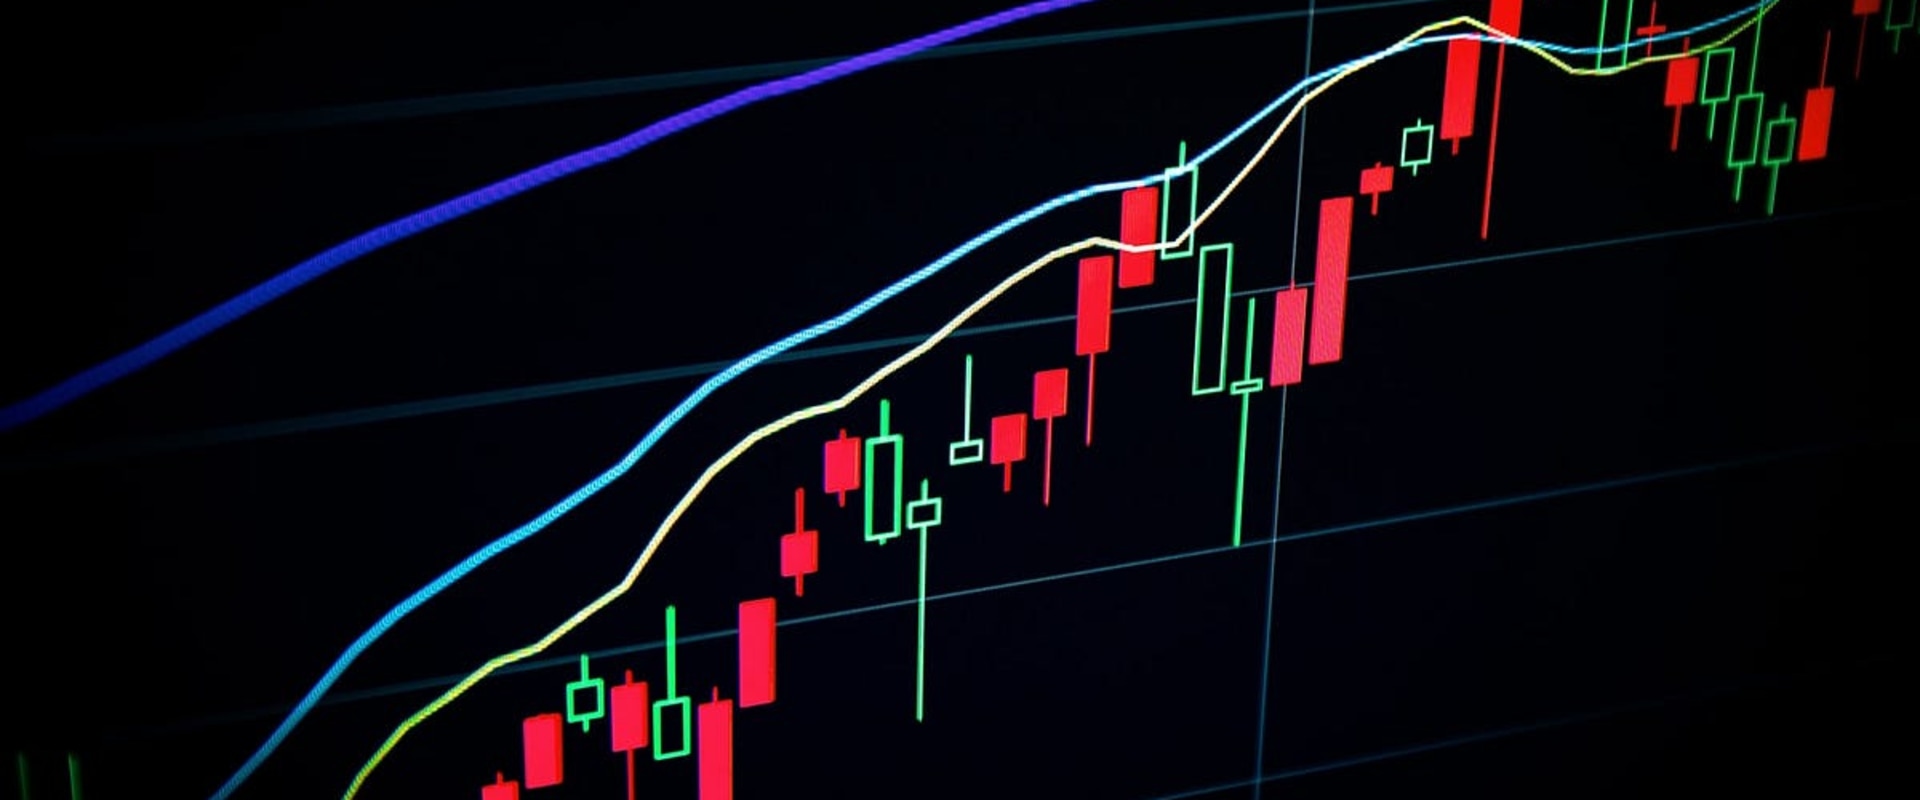
In the rapidly evolving landscape of digital finance, Bitcoin trading has emerged as a prominent avenue for investors seeking to capitalize on the volatility and potential profitability of cryptocurrencies. Unlike traditional assets, Bitcoin operates in a decentralized environment, where price movements can be influenced by a myriad of factors including market sentiment, regulatory news, and technological advancements. This unique nature of Bitcoin necessitates a robust approach to trading, one that goes beyond mere speculation and taps into the analytical tools available to traders. At the heart of successful Bitcoin trading lies technical analysistechnical analysis , a method that involves evaluating historical price data and trading volumes to forecast future price movements. By studying charts and employing various indicators, traders can identify patterns that may suggest potential entry and exit points.
This analytical framework is essential for making informed decisions in a market characterized by rapid fluctuations and unpredictable trends. The importance of technical analysis cannot be overstated; it equips traders with the insights needed to navigate the complexities of Bitcoin trading effectively. Understanding how to interpret market signals allows traders to develop strategies that align with their risk tolerance and investment goals. As we delve deeper into the world of Bitcoin trading, we will explore the various tools and techniques that can enhance your trading experience, enabling you to make more calculated decisions in this dynamic market.
What is Technical Analysis?
Technical analysis is a method used by traders and investors to evaluate financial markets by analyzing historical price data and trading volume. This approach is grounded in the belief that past price movements can provide valuable insights into future market behavior.By studying these patterns, traders aim to identify trends and make informed decisions about buying or selling assets, including bitcoins. The core principle of technical analysis is that market prices reflect all available information. This means that any news, events, or changes in market sentiment are already factored into the current price of an asset. Therefore, rather than focusing on the underlying fundamentals of an asset, technical analysts concentrate on price movements and trading volumes to forecast future price action. One of the key components of technical analysis is the use of charts. Charts visually represent price movements over time, allowing traders to identify patterns such as support and resistance levels, trends, and potential reversal points.
Common chart types include line charts, bar charts, and candlestick charts, each providing different perspectives on price action. In the context of bitcoin trading, technical analysis becomes particularly relevant due to the cryptocurrency's inherent volatility. Price fluctuations can be rapid and significant, making it essential for traders to have a reliable method for predicting potential price movements. By employing various technical indicators—such as moving averages, Relative Strength Index (RSI), and Bollinger Bands—traders can gain deeper insights into market dynamics. Moreover, technical analysis is not just about identifying trends; it also involves understanding market psychology. Traders often react similarly to certain price levels or patterns, leading to predictable behaviors that can be exploited for profit.
For instance, if a significant resistance level is breached, it may trigger a wave of buying as traders anticipate further upward movement. In summary, technical analysis serves as a vital tool for those involved in bitcoin trading. By leveraging historical data and market psychology, traders can enhance their decision-making processes and improve their chances of success in this fast-paced environment.
The Role of Indicators in Technical Analysis
In the realm of bitcoin trading, technical indicators serve as essential tools that help traders analyze market trends and make informed decisions. These indicators are mathematical calculations based on historical price and volume data, providing insights into potential future price movements. Understanding the role of these indicators is crucial for anyone looking to navigate the complexities of the bitcoin market. Technical indicators can be broadly categorized into two types: trend indicators and momentum indicators.Each type serves a unique purpose in the analysis process.
Trend Indicators
Trend indicators are designed to identify the direction of the market trend, whether it is upward, downward, or sideways. One of the most widely used trend indicators is the Moving Average (MA). This indicator smooths out price data by creating a constantly updated average price over a specific period. Traders often use different types of moving averages, such as the Simple Moving Average (SMA) and the Exponential Moving Average (EMA), to identify potential entry and exit points based on crossovers.Momentum Indicators
Momentum indicators, on the other hand, measure the speed and strength of price movements.The Relative Strength Index (RSI) is a popular momentum indicator that ranges from 0 to 100. It helps traders identify overbought or oversold conditions in the market. An RSI above 70 typically indicates that an asset may be overbought, while an RSI below 30 suggests it may be oversold. This information can guide traders in making decisions about when to enter or exit trades.
Volatility Indicators
Another important category is volatility indicators, which measure the degree of variation in trading prices over time.Bollinger Bands are a well-known volatility indicator that consists of a middle band (the moving average) and two outer bands that represent standard deviations from this average. When prices approach the outer bands, it may indicate that the asset is overbought or oversold, signaling potential reversal points. In addition to these categories, there are numerous other technical indicators available to traders, including MACD (Moving Average Convergence Divergence) , Stochastic Oscillator , and Fibonacci Retracements. Each of these indicators provides unique insights into market behavior and can be used in various combinations to enhance trading strategies. The effectiveness of technical indicators lies in their ability to distill complex market data into actionable insights. By understanding how to interpret these indicators correctly, traders can make more informed decisions that align with their trading goals and risk tolerance.
Key Technical Indicators for Bitcoin Trading
In the realm of Bitcoin trading, understanding key technical indicators is essential for making informed decisions.These indicators help traders analyze price movements and market trends, providing insights that can lead to profitable trades. Below, we explore three of the most significant technical indicators: Moving Averages, Relative Strength Index (RSI), and Bollinger Bands.
Moving Averages
Moving averages are one of the most widely used technical indicators in Bitcoin trading. They smooth out price data by creating a constantly updated average price over a specific period. This helps traders identify trends more easily.There are two primary types of moving averages:
- Simple Moving Average (SMA): This is calculated by adding the closing prices of Bitcoin over a specified number of periods and then dividing by that number. For example, a 10-day SMA adds the closing prices for the last 10 days and divides by 10.
- Exponential Moving Average (EMA): Unlike the SMA, the EMA gives more weight to recent prices, making it more responsive to new information. This can be particularly useful in volatile markets like Bitcoin.
Relative Strength Index (RSI)
The Relative Strength Index (RSI) is a momentum oscillator that measures the speed and change of price movements.It ranges from 0 to 100 and is typically used to identify overbought or oversold conditions in the market. An RSI above 70 generally indicates that Bitcoin is overbought, while an RSI below 30 suggests it is oversold. To calculate the RSI, you first determine the average gains and losses over a specified period (commonly 14 days). The formula is as follows:
- RSI = 100 - (100 / (1 + RS))
- Where RS = Average Gain / Average Loss
Bollinger Bands
Bollinger Bands are another popular technical indicator used in Bitcoin trading.They consist of three lines: the middle line is a simple moving average (usually set to 20 periods), while the upper and lower bands are set two standard deviations away from this average. This creates a channel that adapts to market volatility. The key aspects of Bollinger Bands include:
- Volatility Measurement: When the bands widen, it indicates increased volatility; when they contract, it suggests lower volatility.
- Overbought/Oversold Conditions: Prices touching or exceeding the upper band may indicate that Bitcoin is overbought, while prices near or below the lower band may suggest it is oversold.
How to Use Technical Indicators Effectively
To maximize the effectiveness of technical indicators in Bitcoin trading, it is essential to understand how to use them in conjunction with one another.Relying on a single indicator can lead to misleading signals, as no single tool can capture the full complexity of market dynamics. By combining multiple indicators, traders can create a more robust trading strategy that accounts for various market conditions.
Understanding Market Context
Before diving into the specifics of combining indicators, it’s crucial to consider the broader market context. Different market conditions—such as trending, ranging, or volatile markets—can significantly affect the performance of technical indicators. For instance, during a strong uptrend, momentum indicators like the Relative Strength Index (RSI) may remain in overbought territory for extended periods.
In contrast, during a ranging market, these same indicators might provide more reliable signals for entry and exit points.
Combining Indicators for Enhanced Signals
When combining indicators, traders should aim for a mix that provides complementary insights. Here are some effective combinations:
- Moving Averages and RSI: Using moving averages to identify the overall trend while employing RSI to gauge momentum can help traders pinpoint optimal entry and exit points. For example, if the price is above a moving average and RSI indicates oversold conditions, it may signal a buying opportunity.
-
Bollinger Bands and MACD: Bollinger Bands can help identify volatility and potential reversal points. When combined with the Moving Average Convergence Divergence (MACD) indicator, traders can confirm trends and reversals.
A price touching the lower Bollinger Band along with a bullish MACD crossover could indicate a strong buying signal.
- Fibonacci Retracement Levels and Stochastic Oscillator: Fibonacci retracement levels can help identify potential support and resistance areas. When these levels align with stochastic oscillator signals indicating overbought or oversold conditions, it can provide a powerful confirmation for entering trades.
Interpreting Combined Signals
While combining indicators can enhance trading strategies, it’s vital to interpret their signals carefully. Traders should look for confluence—where multiple indicators provide similar signals—to increase confidence in their decisions. However, it’s also important to remain flexible; if market conditions change or if new data emerges, be prepared to adjust your strategy accordingly. In conclusion, effectively using technical indicators involves not only understanding each tool's individual strengths but also recognizing how they interact within different market contexts.
By combining indicators thoughtfully and interpreting their signals in light of current market conditions, traders can develop more effective strategies that enhance their chances of success in Bitcoin trading.
Common Mistakes in Technical Analysis and How to Avoid Them
In the realm of bitcoin trading, technical analysis serves as a vital tool for making informed decisions. However, many traders, especially those new to the market, often fall into common pitfalls that can hinder their success. Understanding these mistakes and learning how to avoid them is essential for improving trading outcomes.1.Overreliance on Indicators
One of the most prevalent mistakes in technical analysis is placing too much trust in indicators without considering the broader market context. While indicators like moving averages and the Relative Strength Index (RSI) can provide valuable insights, they should not be used in isolation.
Traders often forget that indicators are lagging tools; they reflect past price movements rather than predict future ones.
Tip:
Always combine indicators with other forms of analysis, such as fundamental analysis or market sentiment, to gain a more comprehensive view of the market.
2.Ignoring Market Trends
Another common error is neglecting to recognize prevailing market trends. Many traders make the mistake of trying to predict reversals in a strong trend, which can lead to significant losses. For instance, attempting to short-sell bitcoins during a bullish trend can be detrimental.
Tip:
Use trend lines and channels to identify and follow the direction of the market. Always trade in the direction of the trend unless there is a clear reversal signal.
3.Lack of a Trading Plan
A well-defined trading plan is crucial for success in bitcoin trading.
Many traders enter positions without a clear strategy, leading to impulsive decisions based on emotions rather than analysis. This lack of discipline can result in missed opportunities or unnecessary losses.
Tip:
Develop a comprehensive trading plan that outlines your entry and exit strategies, risk management rules, and profit targets. Stick to this plan to maintain discipline.
4.Failing to Manage Risk
Risk management is often overlooked by traders who focus solely on potential profits. Failing to set stop-loss orders or risking too much capital on a single trade can lead to devastating losses.
Tip:
Always implement risk management strategies by setting stop-loss orders and only risking a small percentage of your trading capital on each trade.
5.Emotional Trading
Emotions can cloud judgment and lead to poor decision-making in trading.
Fear and greed are two powerful emotions that can cause traders to deviate from their plans, resulting in impulsive trades or holding onto losing positions for too long.
Tip:
Practice emotional discipline by sticking to your trading plan and using tools like journaling to reflect on your trades and emotional responses.
By being aware of these common mistakes and implementing strategies to avoid them, traders can enhance their technical analysis skills and improve their overall performance in bitcoin trading.
The Importance of Market Sentiment in Technical Analysis
Market sentiment plays a pivotal role in the world of Bitcoin trading, influencing price movements and trader behavior. Understanding this sentiment can provide traders with valuable insights that go beyond traditional technical analysis. Market sentiment refers to the overall attitude of investors toward a particular asset or market, which can be driven by various factors including news events, social media trends, and macroeconomic indicators. In the context of Bitcoin, sentiment can shift rapidly due to its volatile nature. For instance, positive news such as institutional adoption or regulatory clarity can lead to bullish sentiment, driving prices higher.Conversely, negative news like security breaches or regulatory crackdowns can create bearish sentiment, resulting in price declines. Therefore, being attuned to market sentiment is essential for making informed trading decisions.
Impact of Sentiment on Trading
The impact of market sentiment on trading cannot be overstated. Traders often react not just to the actual news but also to the perceived implications of that news. This psychological aspect can lead to phenomena such as herd behavior, where traders collectively buy or sell based on prevailing sentiment rather than fundamental analysis.- Herd Behavior: When traders see others buying Bitcoin due to positive sentiment, they may feel compelled to join in, further driving up prices.
- Panic Selling: Conversely, if negative sentiment prevails, traders may rush to sell their holdings, exacerbating price drops.
Social media platforms like Twitter and Reddit are rich sources of real-time sentiment data. By monitoring discussions and trends on these platforms, traders can gauge public opinion and adjust their strategies accordingly.
Sentiment Analysis Techniques
Several techniques can be employed for sentiment analysis in Bitcoin trading:- Sentiment Indicators: Tools like the Fear and Greed Index provide a quantitative measure of market sentiment based on various factors such as volatility and social media activity.
- News Sentiment Analysis: Analyzing headlines and articles for positive or negative language can help traders anticipate market reactions.
- Volume Analysis: High trading volumes during periods of positive sentiment may indicate strong buying interest, while low volumes during negative sentiment could suggest a lack of conviction among sellers.
Practical Application: Developing a Trading Strategy Using Technical Analysis
Creating a successful trading strategy for Bitcoin involves a systematic approach that integrates technical analysis. This process not only helps in identifying potential entry and exit points but also aids in managing risk effectively.Here’s a step-by-step guide to developing a comprehensive trading strategy using technical analysis.
1.Define Your Trading Goals
- Establish clear objectives: Determine whether you are looking for short-term gains or long-term investments.
- Set risk tolerance: Understand how much capital you are willing to risk on each trade.
- Time commitment: Decide how much time you can dedicate to monitoring the market and executing trades.
2.Choose Your Technical Indicators
Select indicators that align with your trading style. Some popular choices include:
- Moving Averages: Useful for identifying trends over specific periods.
- Relative Strength Index (RSI): Helps determine overbought or oversold conditions.
- Bollinger Bands: Indicates volatility and potential price reversals.
- MACD (Moving Average Convergence Divergence): A trend-following momentum indicator that shows the relationship between two moving averages.
3.Analyze Historical Data
Utilize historical price charts to identify patterns and trends. Look for:
- Support and resistance levels: These are critical price points where the market tends to reverse direction.
- Chart patterns: Recognize formations such as head and shoulders, triangles, or flags that may indicate future movements.
4.Develop Entry and Exit Rules
Your strategy should include specific criteria for entering and exiting trades:
- Entry Criteria: For example, buy when the price crosses above the 50-day moving average and RSI is below 30.
- Exit Criteria: Sell when the price hits a predetermined profit target or if the RSI indicates overbought conditions above 70.
5.Implement Risk Management Techniques
A robust trading strategy must incorporate risk management to protect your capital:
- Stop-Loss Orders: Set stop-loss orders to limit potential losses on each trade.
- Diversification: Avoid putting all your capital into one trade; spread your investments across different assets.
6.Backtest Your Strategy
Before applying your strategy in real-time, backtest it using historical data to evaluate its effectiveness. Adjust your indicators and rules based on the results to optimize performance.
7.Monitor and Adjust Your Strategy
The cryptocurrency market is highly volatile, so it’s essential to continuously monitor your strategy's performance and make adjustments as needed.
Stay informed about market news and trends that could impact Bitcoin prices. By following these steps, you can develop a well-rounded trading strategy that leverages technical analysis effectively, enhancing your chances of success in Bitcoin trading.
Conclusion: Mastering Technical Analysis for Successful Bitcoin Trading
In conclusion, mastering technical analysis and indicators is essential for anyone looking to navigate the complex world of Bitcoin trading successfully. Throughout this article, we have explored the fundamental concepts of technical analysis, the various indicators available, and how they can be effectively utilized to inform trading decisions. Understanding the principles of technical analysis allows traders to analyze historical price movements and volume data, which can reveal patterns and trends that are crucial for predicting future price behavior. By leveraging tools such as moving averages, Relative Strength Index (RSI), and Bollinger Bands, traders can gain insights into market sentiment and identify potential entry and exit points. Moreover, it is important to remember that no single indicator is foolproof. The cryptocurrency market, particularly Bitcoin, is known for its volatility and unpredictability.Therefore, employing a combination of indicators can provide a more comprehensive view of market conditions. This multifaceted approach helps mitigate risks and enhances the likelihood of making informed trading decisions. Additionally, staying updated on market trends and continuously refining your technical analysis skills is vital. The cryptocurrency landscape is ever-evolving, with new developments and technologies emerging regularly. By remaining adaptable and informed, traders can better position themselves to capitalize on opportunities as they arise. Ultimately, successful Bitcoin trading hinges on a trader's ability to interpret data accurately and make strategic decisions based on that analysis.
By mastering technical analysis and understanding how to apply various indicators effectively, you can significantly improve your chances of success in the dynamic world of Bitcoin trading.